

Data updated through August 7, 2026
The global logistics market entered August 2026 with mixed signals. Ocean freight rates on several major Asia–U.S. and Asia–Europe trade lanes have eased after the sharp increases seen at the beginning of the peak season. However, overall freight levels remain elevated, vessel schedules are not yet fully stable, blank sailings continue to affect capacity, and carriers are still applying various route-specific surcharges.
For Vietnamese importers, exporters and manufacturers, this is not necessarily the right time to delay bookings in anticipation of significantly lower rates. A more practical approach is to monitor each trade lane individually, evaluate total “all-in” logistics costs, maintain alternative sailing options and prepare documentation early to minimize unexpected disruptions.
Businesses can also review KVN Logistics’ earlier market update, Vietnam Import-Export Logistics Update – June 2026 and Outlook for July, to better understand how the market has evolved in recent months.
August 2026 Logistics Market Update: Key Takeaways
As of August 7, 2026, businesses should pay attention to four major developments:
- Drewry’s World Container Index increased by 1% on August 6 to USD 4,297 per 40-foot container, following three consecutive weeks of decline. This suggests that the market has temporarily stabilized, although a broad-based upward trend has not yet emerged.
- Reference freight rates from Asia to the U.S. West Coast, U.S. East Coast, Northern Europe and the Mediterranean declined in the week ending July 29, with decreases ranging from 1% to 12%.
- Approximately 58 of the 723 scheduled sailings on major East–West trade lanes are expected to be cancelled between August 3 and September 6, equivalent to around 8% of planned sailings.
- Peak Season Surcharges, bunker-related charges, security-related fees and local charges may still apply even as spot freight rates decline on certain routes. (drewry.co.uk)
1. Ocean Freight Rate Developments in Early August 2026
Global freight rates stop falling, but no major rebound yet
Drewry’s World Container Index reached USD 4,297 per 40-foot container on August 6, 2026, representing a 1% increase from the previous week. This was the first weekly increase following three consecutive weeks of decline.
At the same time, the Drewry Intra-Asia Container Index also rose by 1% to USD 970 per 40-foot container. The movement indicates that cost pressures and operational risks remain present on intra-Asia routes, particularly those involving the Middle East or major transshipment hubs. (drewry.co.uk)
Global freight indices provide a useful market benchmark, but actual ocean freight rates from Vietnam depend on multiple factors, including:
- Port of loading and port of discharge;
- Carrier and direct or transshipment service;
- Container type and equipment availability;
- Cargo type, weight and special handling requirements;
- Cargo ready date;
- Quotation validity;
- Free time and applicable surcharges.
Businesses should therefore avoid using a single international freight index as a fixed budgeting benchmark for every shipment.
Asia–U.S. and Asia–Europe rates are correcting
The latest route-level Freightos data published on July 29, 2026 showed:
- Asia–U.S. West Coast rates fell 12% to USD 6,212/FEU;
- Asia–U.S. East Coast rates decreased 1% to USD 9,002/FEU;
- Asia–Northern Europe rates fell 3% to USD 5,575/FEU;
- Asia–Mediterranean rates decreased 2% to USD 6,697/FEU. (freightos.com)
These figures represent regional Asia trade-lane benchmarks rather than direct quotations from Vietnam. Nevertheless, they indicate that the sharp rate increases seen in June and early July have begun to ease on several major corridors.
The correction has been driven mainly by signs that peak-season demand is ending earlier than expected on some routes, while carriers have also added capacity.
However, the pace of adjustment varies significantly by trade lane. U.S. West Coast rates have declined more rapidly than East Coast rates, while Mediterranean rates remain higher than those to Northern Europe. (freightos.com)
Vietnam–U.S. trade: Lower freight rates, but higher total-cost risks
The United States remained Vietnam’s largest export market in the first six months of 2026, with exports estimated at approximately USD 86.5 billion.
Demand for Vietnam–U.S. transportation therefore remains substantial, particularly for industrial products, packaging, machinery, furniture, textiles, electronics and consumer goods. (nso.gov.vn)
Lower ocean freight does not necessarily translate into an equivalent reduction in the total landed logistics cost.
Businesses must also account for:
- AMS;
- ISF;
- THC;
- Documentation fees;
- Destination charges;
- Detention and demurrage;
- Inland transportation;
- Import duties and taxes.
For further preparation on the U.S. route, businesses can refer to:
- Shipping to the USA in 2026: Key Changes Businesses Need to Know
- Shipping from Vietnam to the USA: FCL, LCL and Customs Procedures
Vietnam–Europe trade: Continue monitoring PSS and transshipment risks
Reference rates from Asia to Northern Europe and the Mediterranean eased slightly toward the end of July.
However, Peak Season Surcharges and charges associated with fuel, security, contingency measures and vessel routing may continue to keep the actual all-in cost relatively high.
Exporters to Europe should therefore compare not only ocean freight rates but also:
- Sailing frequency;
- Number of transshipments;
- Transit time;
- Destination port;
- Connection waiting times;
- Free time at destination.
More details are available in KVN Logistics’ article Sea Freight to Europe: Transit Time, Costs and Risks.
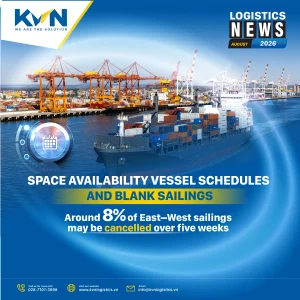
2. Space Availability, Vessel Schedules and Blank Sailings
Around 8% of East–West sailings may be cancelled over five weeks
Drewry forecasts 58 blank sailings out of 723 scheduled voyages across major East–West trade lanes between Week 32 and Week 36, covering the period from August 3 to September 6, 2026.
This represents approximately 8% of total planned sailings. (drewry.co.uk)
Blank sailings can create a series of operational consequences:
- Cargo may be rolled to the next vessel;
- Space becomes tighter on remaining sailings;
- Empty container availability may become uneven;
- Transshipment cargo may face longer connection times;
- ETD and ETA may change after booking confirmation;
- Businesses may incur additional warehousing, trucking or container-related costs.
As a result, the market may simultaneously experience declining spot freight rates and continued difficulties in securing reliable delivery schedules.
Global schedule reliability remains around 62.6%
Sea-Intelligence reported that global container shipping schedule reliability decreased by 1.9 percentage points in June 2026, reaching 62.6%.
The average delay for late vessel arrivals improved to 5.31 days.
However, this still means that shipments tied to strict production deadlines or contractual delivery dates require sufficient schedule buffers. (sea-intelligence.com)
By carrier, Maersk recorded schedule reliability of 77.1%, Hapag-Lloyd 75.6% and MSC 72.1%. These were the only three among the 13 largest carriers to exceed 70% reliability in June. (sea-intelligence.com)
These figures do not mean that one shipping line will always be more suitable than another. Actual reliability depends on the specific service, port pair, transshipment arrangement and booking period.
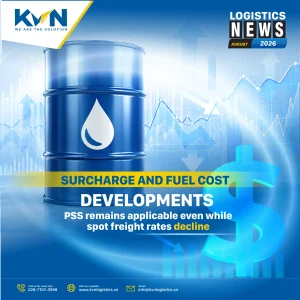
3. Surcharge and Fuel Cost Developments
PSS remains applicable even while spot freight rates decline
One common misunderstanding is that spot freight rates and carrier surcharge schedules always move in the same direction.
They do not.
Maersk announced a revised Peak Season Surcharge for cargo moving from Far East Asia, including Vietnam, to Northern Europe and the Mediterranean, effective July 22, 2026:
- USD 500 per 20-foot container;
- USD 1,000 per 40-foot or 45-foot container. (maersk.com)
CMA CGM also announced a PSS from Asian ports to Northern Europe at USD 1,000 per TEU, effective July 1, 2026 for agreements with durations exceeding 30 days.
The carrier noted that bunker-related charges, THC, security charges, contingency charges and local charges may still apply separately. (cma-cgm.com)
On other trade lanes, Maersk announced:
- A USD 300/container PSS from Vietnam and several Asian origins to Pipavav, JNPT, Mundra and Pakistan;
- A PSS from Vietnam to Saudi Arabia effective August 10, 2026, at USD 1,000 per 20-foot container and USD 2,000 per 40-foot or 45-foot container. (maersk.com)
These figures represent individual carrier announcements and should not be interpreted as market-wide surcharges.
Final charges depend on the booking type, rate validity date, contractual terms, specific service and additional local charges.
Businesses can also review Common Logistics Surcharges Businesses Often Overlook to develop a more complete logistics budget.
Charges that should be clarified before confirming a booking
A freight quotation should clearly identify at least:
- Ocean freight;
- PSS, GRI and BAF;
- Origin and destination THC;
- Documentation and bill of lading fees;
- CIC or equipment imbalance charges;
- Seal fees;
- CFS charges for LCL cargo;
- Free-time conditions;
- Detention and demurrage;
- Storage charges;
- Security, war-risk or contingency surcharges where applicable;
- Quotation validity and adjustment conditions.
Comparing freight quotations based solely on ocean freight can result in choosing an option that looks cheaper initially but carries a higher total cost.
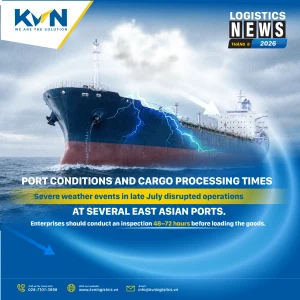
4. Port Conditions and Cargo Processing Times
Severe weather events in late July disrupted operations at several East Asian ports.
Freightos reported vessel bunching at Shanghai and Ningbo, multi-day waiting times at Qingdao, and operational delays across eastern China, Taiwan, South Korea and the Philippines.
Some carriers were required to omit ports, adjust vessel rotations or reroute cargo through alternative transshipment arrangements.
These disruptions may increase connection times for shipments from Vietnam that depend on regional hub ports. (freightos.com)
Port conditions can recover quickly after weather conditions improve. Nevertheless, businesses should reconfirm the following within 48–72 hours of cargo closing:
- Vessel status;
- Latest ETD;
- Revised cut-off times;
- Transshipment port;
- Connection availability;
- Empty container availability;
- CY closing time;
- Trucking and loading plans;
- Contingency options if the vessel is delayed.
For shipments requiring coordination between factories, warehouses and ports, businesses can combine KVN Logistics’ Inland Transportation service with their ocean freight booking plan to reduce disruption risks at origin.
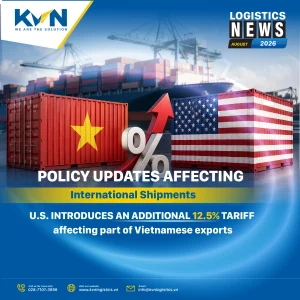
5. Policy Updates Affecting International Shipments
U.S. introduces an additional 12.5% tariff affecting part of Vietnamese exports
Effective July 24, 2026, Eastern Time, the United States implemented Section 301 tariff measures relating to goods produced wholly or partly using forced labor.
Vietnam is among the economies subject to an additional 12.5% tariff covering approximately 37% of its current exports to the United States, after excluding products covered by exemptions under U.S. regulations. (moit.gov.vn)
This is not an ocean freight surcharge, but it can directly affect:
- Landed cost in the United States;
- Importers’ purchasing plans;
- Shipment timing;
- Origin and raw-material traceability requirements;
- Contractual tariff-sharing arrangements;
- Potential documentation checks or additional compliance requirements.
Businesses should verify the correct HS code, exemption status, product origin and responsibility for paying duties under the agreed Incoterms.
They should not assume that all exports from Vietnam are subject to the same tariff rate.
KVN Logistics provides further details in U.S. Imposes Additional 12.5% Tariff on Vietnamese Goods from July 24, 2026.
Vietnam’s foreign trade continues to expand strongly
Vietnam’s total merchandise trade reached approximately USD 549.69 billion in the first six months of 2026, an increase of 27.1% year on year.
Of this total:
- Exports reached USD 266.52 billion, up 21%;
- Imports reached USD 283.17 billion, up 33.4%;
- The country recorded a trade deficit of USD 16.65 billion;
- The United States was Vietnam’s largest export market at USD 86.5 billion;
- China was the largest import market at USD 115.2 billion. (nso.gov.vn)
The faster increase in imports indicates continued strong demand for raw materials, components, machinery and production inputs.
This could increase pressure on inland transportation capacity, container availability, warehousing and working capital during the final months of the year.

6. Impact on Manufacturers and Import-Export Businesses
Logistics costs may not decrease in line with ocean freight rates
Ocean freight rates may fall while PSS, local charges, trucking costs, warehousing costs and expenses resulting from vessel schedule changes remain elevated.
Businesses should therefore monitor total logistics cost per shipment, order or unit of product rather than comparing only the basic ocean freight rate.
Production lead times should include transportation risks
With the average delay for late vessels at approximately 5.31 days, delivery schedules should not be calculated simply by adding the carrier’s advertised transit time.
Businesses with urgent orders or fixed contractual delivery dates should consider adding a buffer of approximately 5–7 days and communicating potential ETD, ETA and transshipment changes with customers in advance.
Profit margins may face multiple pressures
Vietnamese exporters to the United States may simultaneously face:
- Freight rates and transportation surcharges;
- Additional import tariffs;
- Traceability and compliance costs;
- Financing costs caused by longer transit times;
- Warehousing, container and late-delivery risks.
Sales, import-export, finance and production teams should therefore work from the same updated logistics cost sheet rather than preparing quotations based on outdated freight or tariff levels.

7. Booking Recommendations for August 2026
1. Plan booking lead times by trade lane
KVN Logistics recommends the following indicative booking lead times:
- U.S. and European routes: book at least 2–3 weeks in advance;
- Fixed-deadline cargo, special equipment or heavy cargo: prepare 3–4 weeks in advance;
- Standard intra-Asia routes: allow approximately 7–14 days;
- Middle East routes or services involving multiple transshipments: prepare 2–3 weeks ahead.
Actual lead times may vary depending on the carrier, service, equipment type and prevailing market conditions.
2. Maintain at least two sailing options
For every important shipment, businesses should ideally prepare:
- A primary option prioritizing transit time;
- A backup carrier or sailing schedule;
- Information on the next available vessel in case of a blank sailing;
- An assessment of transshipment risks;
- Air freight or multimodal alternatives for particularly urgent cargo.
Businesses can explore KVN Logistics’ Sea Freight solutions for FCL, LCL, consolidation and project cargo requirements.
3. Request quotations with clearly defined conditions
Before confirming a booking, businesses should clarify:
- Which charges are included;
- Which charges remain subject to adjustment;
- Quotation expiry date;
- Effective date of PSS or GRI;
- Origin and destination free time;
- Responsibility when vessel schedules change;
- Cancellation or booking amendment charges;
- Charges arising from vessel, port or container quantity changes.
4. Check documentation before cut-off
Commercial invoices, packing lists, contracts, HS codes, Certificates of Origin, cargo descriptions and shipper/consignee details should be aligned before bill of lading issuance and customs declaration.
For machinery, medical devices, pharmaceutical or cosmetic ingredients, chemicals, industrial raw materials or goods subject to specialized inspection, documentation should ideally be reviewed before the cargo leaves the factory.
Businesses may refer to KVN Logistics’ Customs Clearance and Import-Export Documentation service for further support.
5. Do not delay bookings solely in anticipation of lower freight rates
Freight rates are correcting on certain trade lanes, but blank sailings, surcharges and schedule risks remain.
Delaying a shipment may not generate enough freight savings to offset the financial or operational impact of a late delivery.
Businesses should prioritize:
- Securing space when a suitable sailing is available;
- Maintaining alternative options;
- Monitoring freight rates weekly;
- Negotiating quotation validity;
- Updating product costing whenever new surcharges are introduced.
8. Logistics Market Outlook for September 2026
The September market is likely to remain highly differentiated by trade lane rather than moving uniformly upward or downward.
Scenario 1: Freight rates continue to ease
Rates may decline further if peak-season demand ends earlier than expected, additional shipping capacity becomes available and carriers compete more aggressively to fill vessels.
This scenario may become particularly visible on trade lanes that already experienced strong corrections at the end of July, including Asia–U.S. West Coast.
Scenario 2: Freight rates and surcharges rise again
Rates could rebound if carriers increase blank sailings, Middle East tensions intensify, fuel prices rise, adverse weather continues to disrupt ports or year-end import demand recovers more strongly than expected.
Middle East and Mediterranean routes, as well as services relying on multiple transshipment points, could experience greater volatility.
Base case: Freight rates remain volatile and route-specific
The more likely scenario is that freight rates will not decline in a straight line.
The market may experience periods of falling rates followed by short-term increases driven by capacity reductions, blank sailings, equipment shortages or new surcharges.
This is KVN Logistics’ assessment based on late-July freight trends, the August 6 World Container Index, scheduled blank sailings and currently announced carrier surcharges. (drewry.co.uk)
KVN Logistics – Request a Route-Specific Freight Update
Every trade lane has its own freight rate dynamics, sailing schedules, surcharges and operational risks.
A general market benchmark cannot replace a shipment-specific quotation.
To receive a more relevant logistics proposal, businesses should provide:
- Port of loading and port of discharge;
- Commodity and expected HS code;
- Quantity, weight and volume;
- Container type;
- Cargo ready date;
- Required transit time;
- Incoterms;
- Documentation or specialized inspection requirements.
KVN Logistics supports businesses in evaluating ocean freight, inland transportation, sailing schedules, applicable surcharges and import-export documentation to balance cost, transit time and operational reliability.
FAQ – August 2026 Logistics Market
Are ocean freight rates increasing or decreasing in August 2026?
The market is showing mixed movements. Reference rates on several Asia–U.S. and Asia–Europe lanes declined in late July, while Drewry’s World Container Index edged higher again in the first week of August.
Businesses should therefore monitor specific port pairs rather than relying on a single global trend.
How far in advance should businesses book?
For U.S. and European routes, businesses should generally prepare bookings around 2–3 weeks in advance.
Cargo with fixed deadlines, special containers or complex transshipment arrangements may require 3–4 weeks of preparation.
Why can carriers still apply PSS when freight rates are falling?
Spot freight rates and carrier surcharge schedules are adjusted through different mechanisms.
PSS may remain applicable depending on the trade lane, booking date, contract type or shipment period even while spot freight rates are declining.
What should businesses check when vessel schedules change?
Key items include ETD, ETA, cut-off time, transshipment port, connection schedule, container availability, free time, trucking arrangements and alternative sailings.
Are the freight rates quoted in this article direct rates from Vietnam?
No.
The figures in this article are international freight indices and market benchmarks used to illustrate market trends.
Actual freight rates from Vietnam depend on the port pair, carrier, service, cargo type, equipment, cargo ready date and applicable surcharges at the time of booking.
Source Notes
- Drewry – Latest Trackers and Indices, updated August 6 and July 31, 2026: World Container Index, Intra-Asia Container Index, blank sailings and port throughput indicators. (drewry.co.uk)
- Freightos – Freight Rate Update, data as of July 29, 2026 and market analysis published July 22, 2026: Asia–U.S., Northern Europe and Mediterranean freight rates and disruption at East Asian ports. (freightos.com)
- Sea-Intelligence, published July 27, 2026: global schedule reliability and average delay for late vessel arrivals in June 2026. (sea-intelligence.com)
- National Statistics Office of Vietnam, July 2026: Vietnam’s merchandise trade performance in the first six months of 2026. (nso.gov.vn)
- Maersk, announcements published in July 2026: Peak Season Surcharges from Far East Asia, including Vietnam, to Northern Europe, the Mediterranean, India, Pakistan and Saudi Arabia. (maersk.com)
- CMA CGM, Peak Season Surcharge announcement for Asia–Northern Europe, effective July 1, 2026. (cma-cgm.com)
- Vietnam Ministry of Industry and Trade, updates published July 25 and July 28, 2026 concerning the USTR Section 301 conclusion and enhanced supply-chain traceability and transparency requirements. (moit.gov.vn)
Note: Freight indices and surcharges cited in this article are provided for market-trend reference purposes only and do not constitute freight quotations. Businesses should reconfirm rates, sailing schedules and applicable conditions at the time of booking.